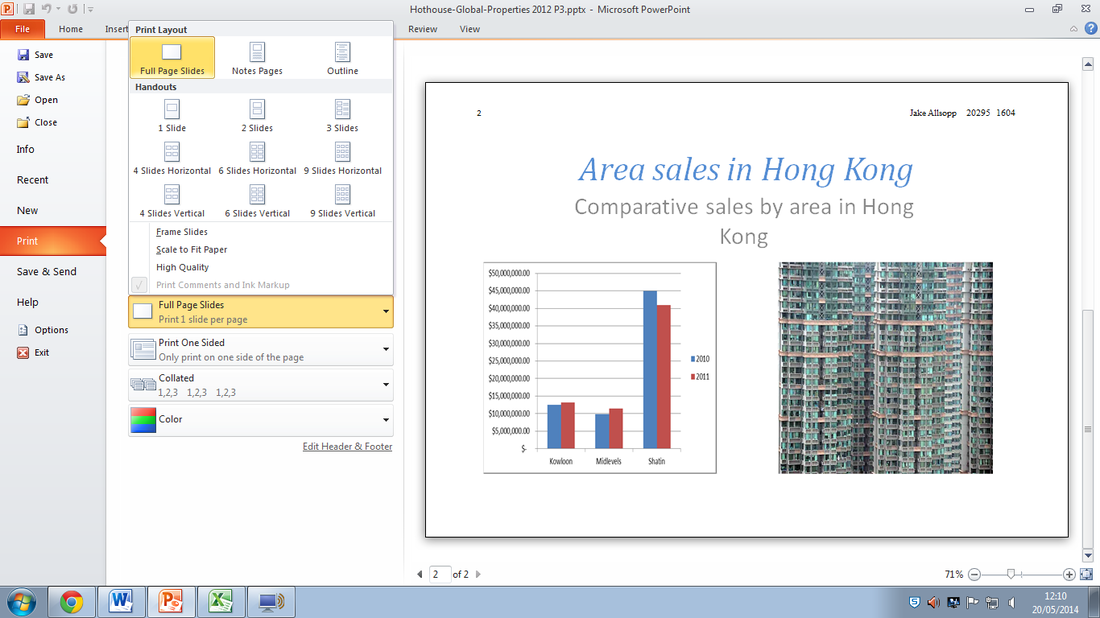
When Printing a Presentation, there are quite a few different Formats you can use to display the slides. For Example, you can have Six Slides on a page. If a Question Specifies the type of Display you should use, find it within the Print Options. To Find this, go to "File" and then to "Print".
1. Open Microsoft Excel - You want to make a new chart from scratch, Not "Import Graph".
2. Type in the Data EXACTLY as it appears in the question. 3. High light ONLY the Data you need, and other boxes will mess up your chart. 4. Go to 'Insert' 5. Select the type of Chart the question specifies you to use (Usually will be a Column or Pie Chart) Once you have made and finished your chart - Check it. Does it look sensible? Have you miss-typed your data? Add any Data/Axis labels by going to the "Chart Tools - Layout" Tab. You can now Copy the Chart into your Presentation! If you want to import something from a different file eg. A word document and want to put it into a powerpoint, you Open a new power point, go to 'New Slide' and select 'Slides from outline' and select the file you want to import. To get into 'Master View' , click on 'View' at the top then on 'Slide Master'
SLIDE MASTER IS NOT FOR MAKING YOUR POWER POINT OR ADDING CONTENT! YOU MUST REMEMBER TO SELECT THE NUMBER ONE SLIDE! DO NOT DELETE THE BIG BOXES ON THE 1st MASTER SLIDE (Except for footers, they can be deleted) Don't type in the Main Boxes on a Master Slide, only use text boxes and you can only change how it looks To Create Slide Numbers, insert a text box and go into 'Insert'. Click on 'Object' and insert an automated page number. |